
Microsoft has quietly added a built-in network packet sniffer to the Windows 10 October 2018 Update, and it has gone unnoticed since its release.
A packet sniffer, or network sniffer, is a program that monitors the network activity flowing over a computer down to an individual packet level.
This can be used by network administrators to diagnose networking issues, see what types of programs are being used on a network, or even listen in on network conversations sent via clear text.
While Linux users always had the tcpdump tool to perform network sniffing, Windows users have had to install third-party programs such as the Microsoft Network Monitor and Wireshark.
This all changed when Microsoft released the October 2018 Update as now Windows 10 comes with a new "Packet Monitor" program called pktmon.exe.
Built-in packet sniffer comes to Windows 10
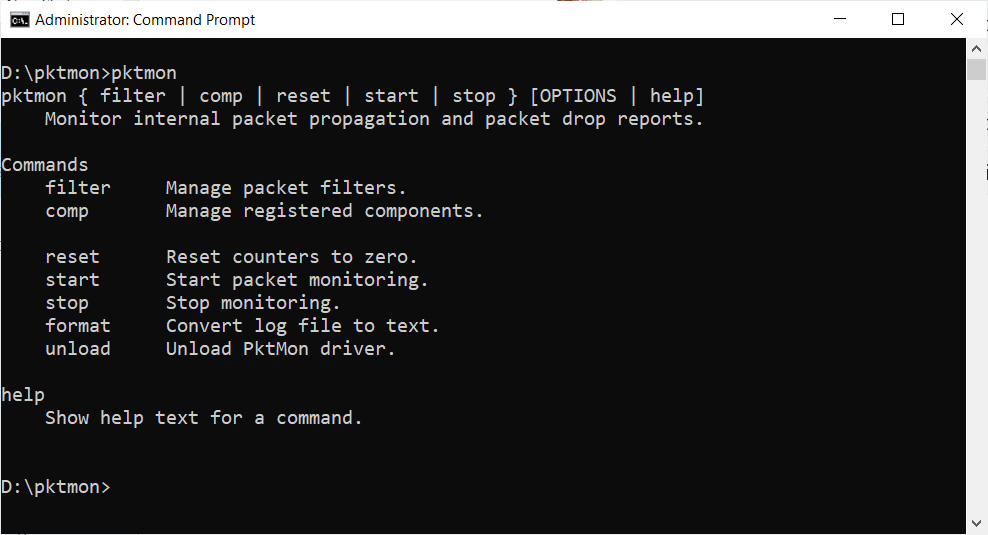
With the release of the Windows 10 October 2018 Update, Microsoft quietly added a new network diagnostic and packet monitoring program called C:\Windows\system32\pktmon.exe.
This program has a description of "Monitor internal packet propagation and packet drop reports", which indicates it is designed for diagnosing network problems.
Similar to the Windows 'netsh trace' command, it can be used to perform full packet inspection of data being sent over the computer.
This program has no mention on Microsoft's site that we could find, and we had to learn how to use it by playing with the program.
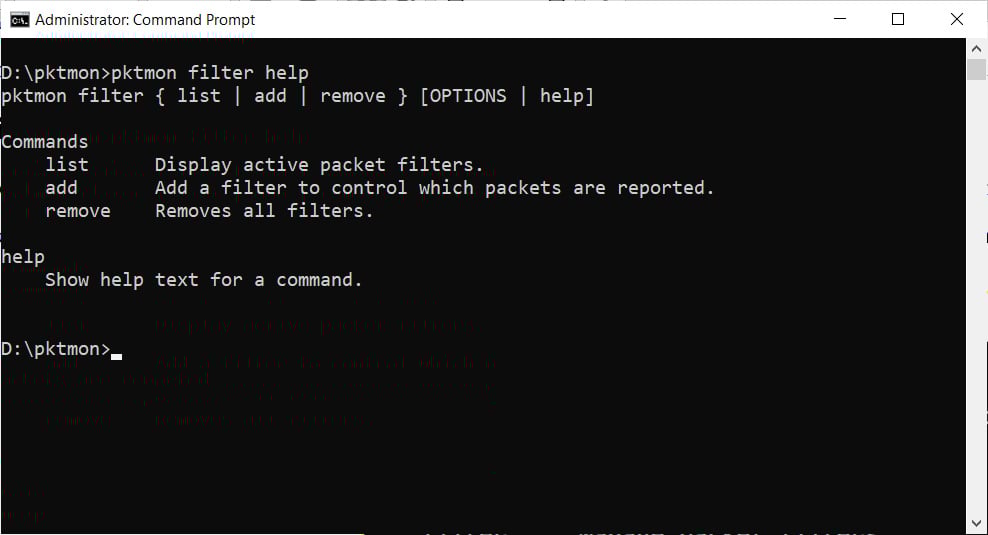
Thankfully it includes a fairly extensive help system that can be used by typing 'pktmon [command] help'.
For example, pktmon filter help, will give you the help screen for the filter command.
To learn how to use Pktmon, I strongly suggest you read through the help documentation and play around with the program. We have also provided an example in the next section to help you get started.
Using Pktmon to monitor network traffic
Unfortunately, diving into the full feature set of Pktmon is outside of the scope of this article, but we wanted to show you a basic example of how you can use the tool.
For our example, we will use Pktmon to monitor FTP traffic from the computer it is run on.
To do this, we first need to launch a Windows 10 elevated command prompt as Pktmon requires administrator privileges.
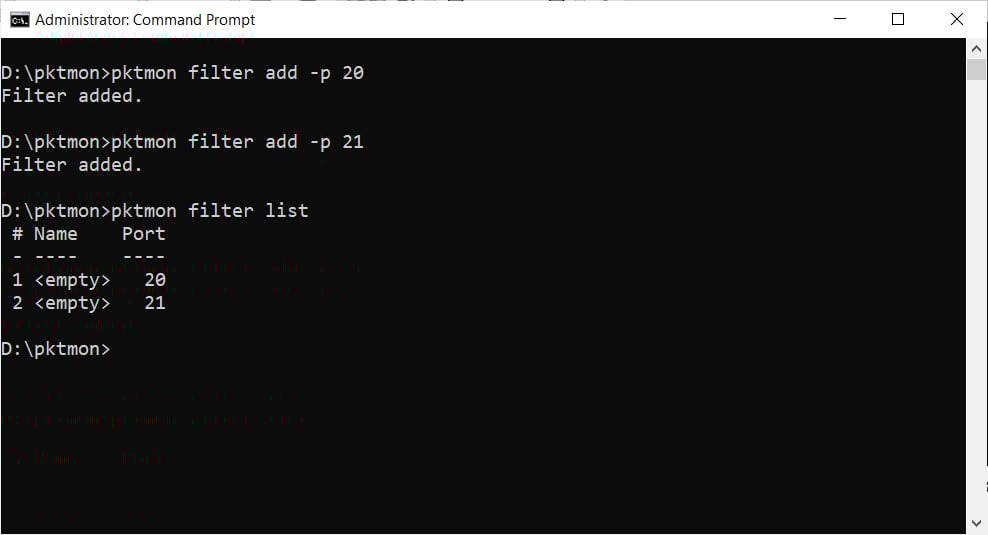
We then need to create two packet filters that tell Pktmon what traffic to monitor, which in our example will be the traffic on TCP ports 20 and 21.
These filters can be created by using the pktmon filter add -p [port] command for each port we want to monitor.
pktmon filter add -p 20
pktmon filter add -p 21
You can then use the pktmon filter list command to see the packet filters we just created.
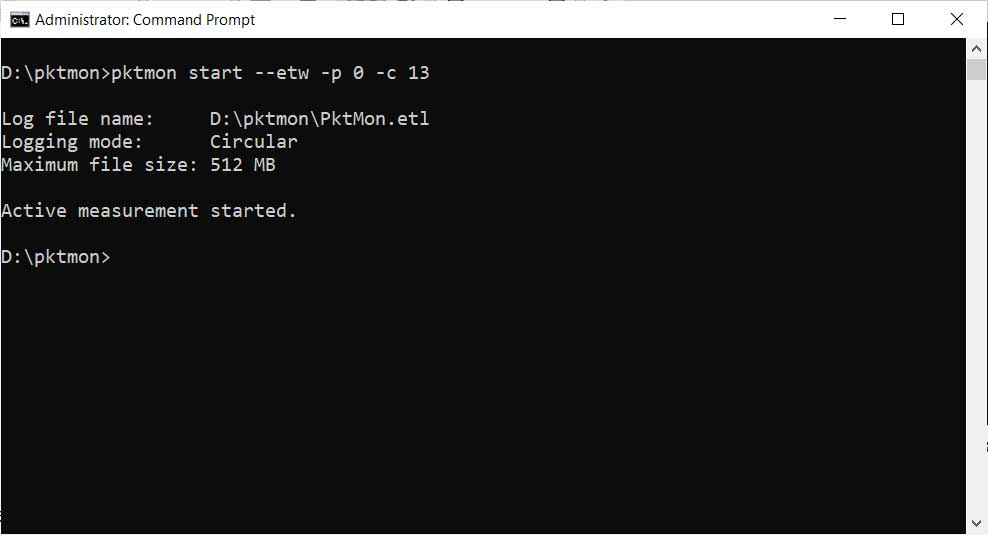
To start monitoring for packets communicating with TCP ports 20 and 21, we need to use the pktmon start --etw command.
Once executed, pktmon will log all packets on ALL network interfaces on the device to a file called PktMon.etl and only record the first 128 bytes of a packet.
To make it log the entire packet and only from a specific ethernet device, you can use the -p 0 (capture entire packet) and -c 13 (capture only from the adapter with ID 13) arguments.
To determine what ID your adapters are, you can run the command pktmon comp list command
When we combine all the arguments, we get a final command of:
pktmon start --etw -p 0 -c 13
Pktmon will now quietly run while capturing all packets that match our inputted filters.
To stop capturing packets, enter the pktmon stop command, and a log file called PktMon.etl will have been created in the same folder that contains the raw captured data.
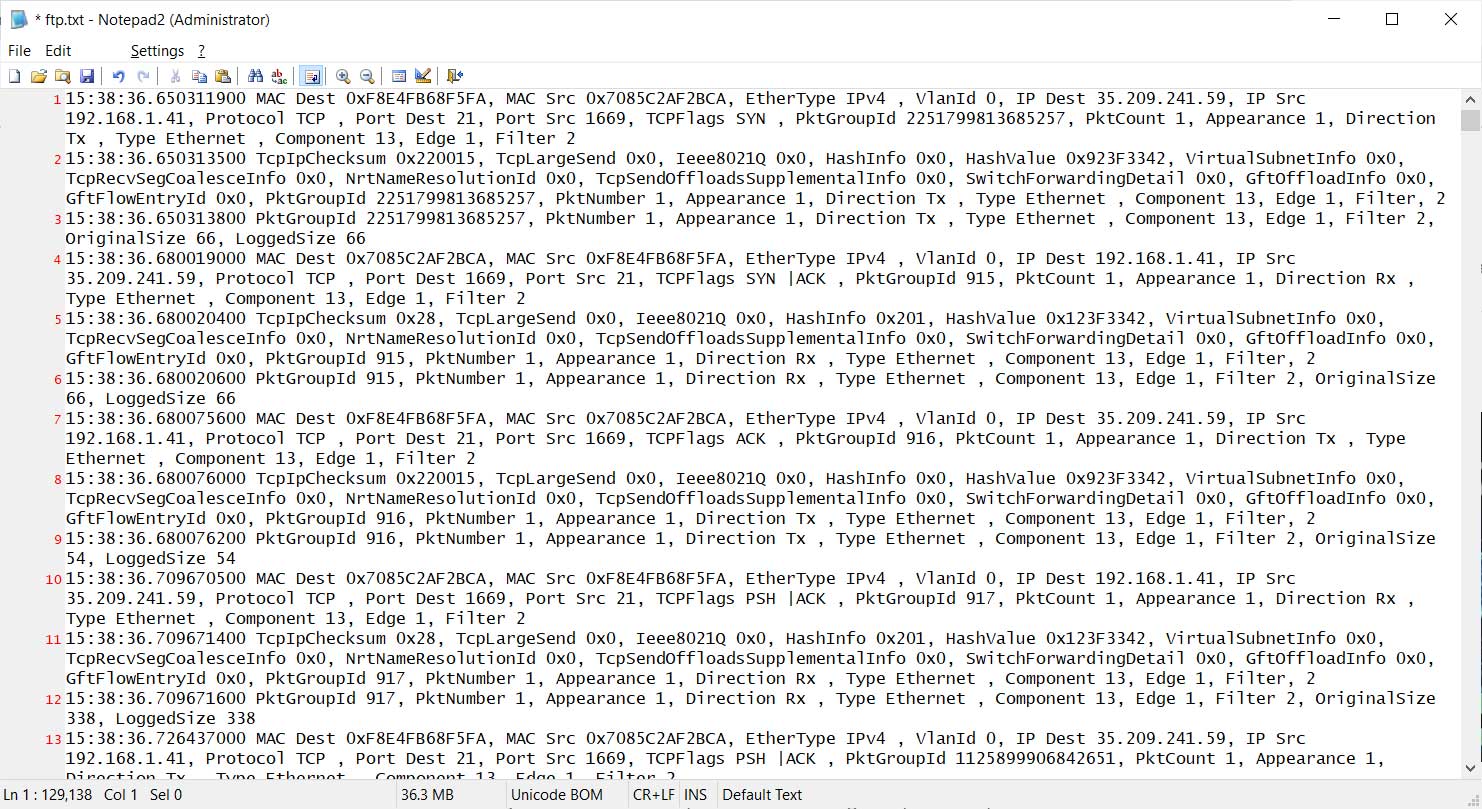
This data in this file is not directly usable, so you need to convert it to a human-readable text format with the following command:
pktmon format PktMon.etl -o ftp.txt
Even converted into text, it is not going to give you the full packets, but only a summary of the network traffic as shown below.
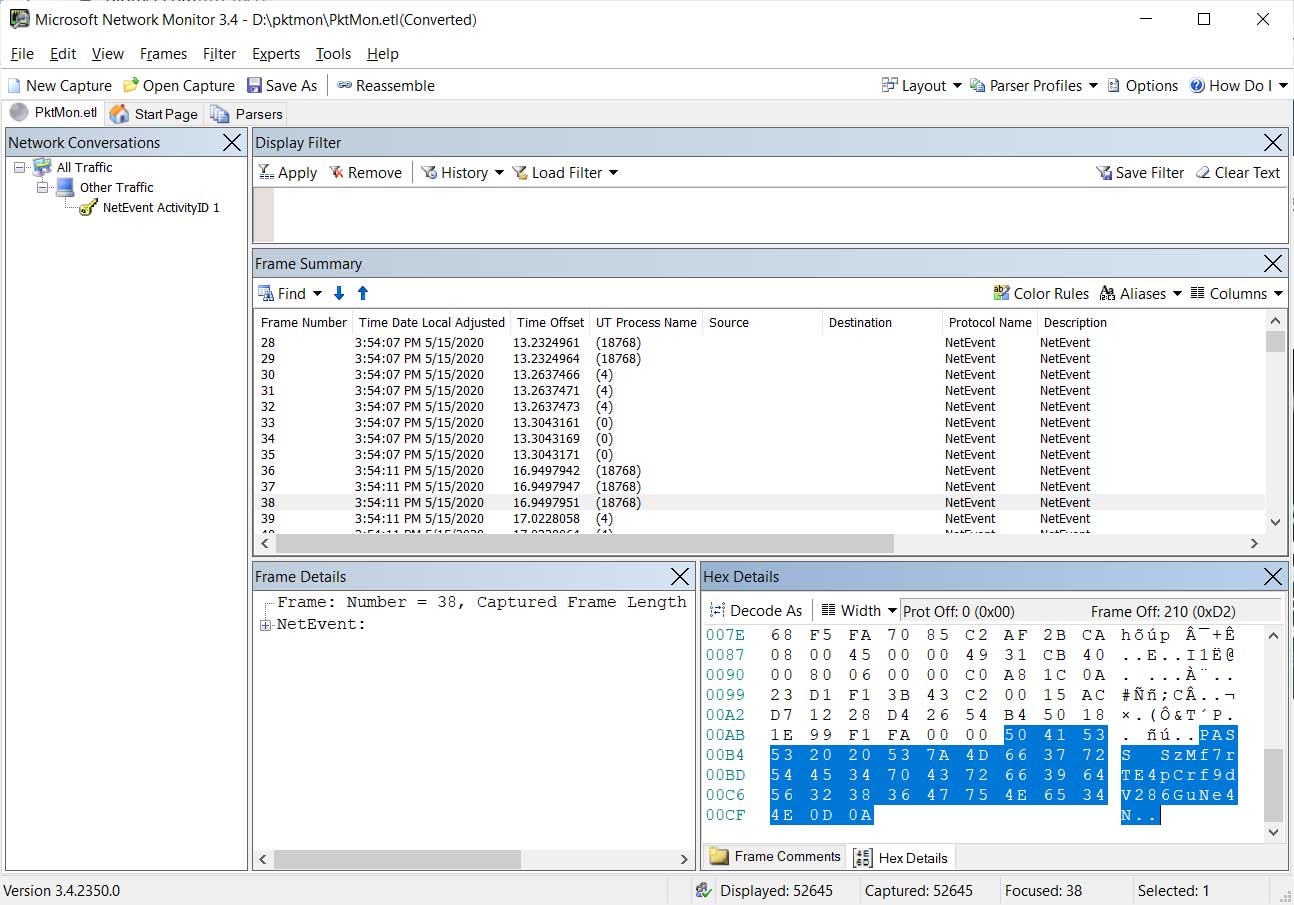
To benefit from the captured data, I suggest you download and install the Microsoft Network Monitor and use it to view the ETL file.
Using Network Monitor, you can see the full packet that was sent, including any clear-text information.
For example, below you can see a packet containing the clear-text password we entered when logging into this FTP test site.
When done using the Pktmon program, you can remove all created filters using the command:
pktmon filter remove
Real-time monitoring and pcapng support coming soon
With the upcoming release of the Windows 10 May 2020 Update (Windows 10 2004), Microsoft has updated the Pktmon tool to allow you to display monitored packets in real-time and to convert ETL files to the PCAPNG format.
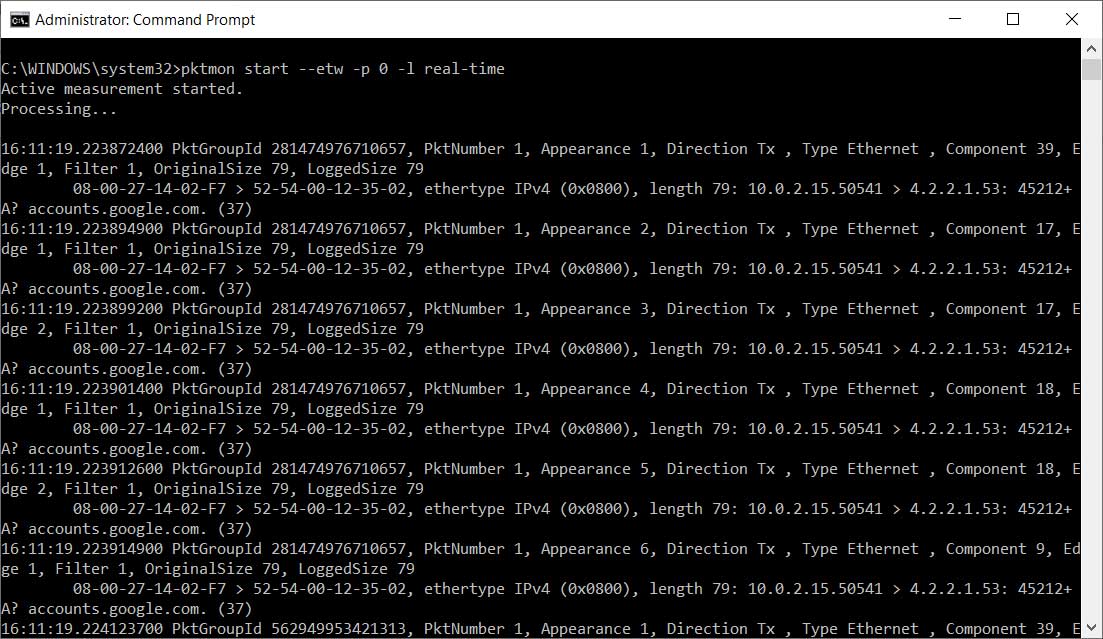
In the version of Pktmon coming in the next feature update, you can enable real-time monitoring using the -l real-time argument.
This will cause the captured packets to be displayed directly to the screen while also saving it to the ETL file.
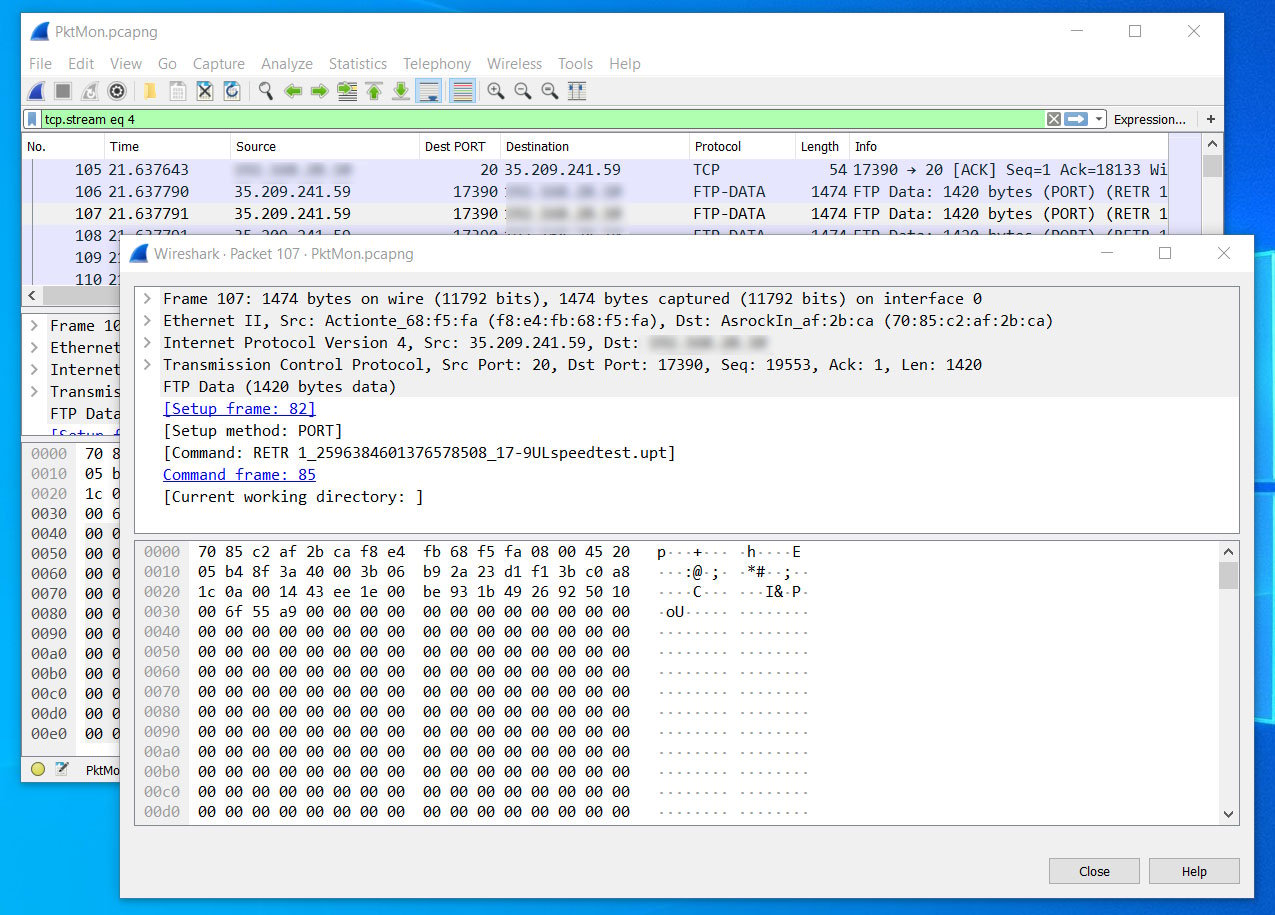
Microsoft is also adding the ability to convert ETL files to the PCAPNG format so that they can be used in programs like Wireshark.
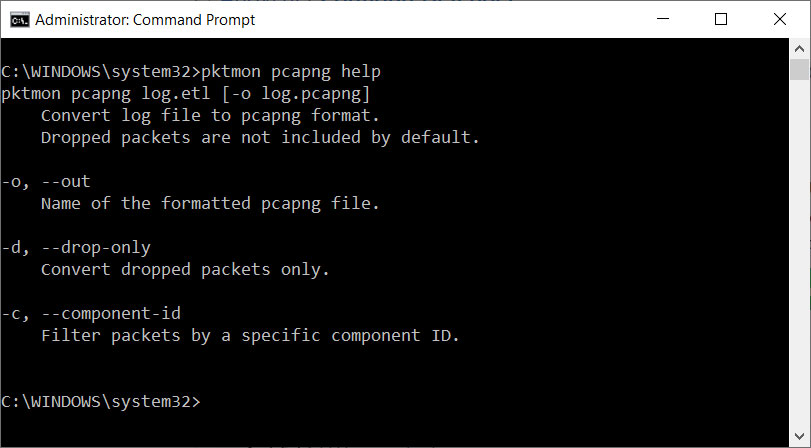
Once the file has been converted into the PCAPNG format, they can be opened into Wireshark so you can view the network communication better.
Once again, these features are not available in Windows 10 1903/1909, and will be coming to Windows 10 2004 when it's released at the end of the month.
Update 5/16/20: Added other new features coming with Windows 10 2004


Comments
ken_smon - 3 years ago
"Once the file has been converted into the PCAPNG format, they can be opened into Wireshark so you can view the network communication better."
Or, you could just install Wireshark?
cyberlibrarian - 3 years ago
After doing some of my own exploring and reading your article, I decided this will be a convenient tool. So I made a little quick reference for it and put it up on GitHub.
https://github.com/cyberlibrarian/pktmon-quick-reference
I asked myself, "Wouldn't I just install Wireshark?" but then I realized, "No... if pktmon is built in *and* it already allow converting ETL to PCAPNG, I would not always install wireshark."
I think there are many cases where I would want to grab a quick pcap during troubleshooting and then grab the pcapng and move it to a central system for analysis. I think in particular I might do this NON-interactively (invoke-pssession or WinRM etc.). While pktmon is not impressive in the way Wireshark is, it will certainly be convenient.
johnd0e8 - 3 years ago
Microsoft just posted (on 5/22) something over on their Networking Blog.
https://techcommunity.microsoft.com/t5/networking-blog/introducting-packet-monitor/ba-p/1410594
adamtpmps02 - 8 months ago
Last post here is about the time all DNS went thru Google LLC.
adamtpmps02 - 8 months ago
Also the Findstr command may help and is also not found in my W10 (+/-) MD-100 ref manual