
In the past we have been looking at page load times of our desktop browser applications and we used concepts like the APDEX to find out what the user experience looks like but since it got defined a lot of things have changed. At Velocity last November I presented that APDEX is dead, and W3C navigation timings are no longer relevant as THE metric since they have big gaps or simply measure useless data. But I also presented an alternative the User/Customer Experience Index which fits the omni-channel user experience management requirements of today.
People asked me to put the details together in a blog and here we go!
In today’s world where technologies like AngularJS change the way web applications work dramatically, Web sites now only consist of a single page load. What about mobile apps? Mobile apps have never had something like a page load. In this blog I want to explain how I think User Experience should be measured and which 5 ingredients are necessary to get there.
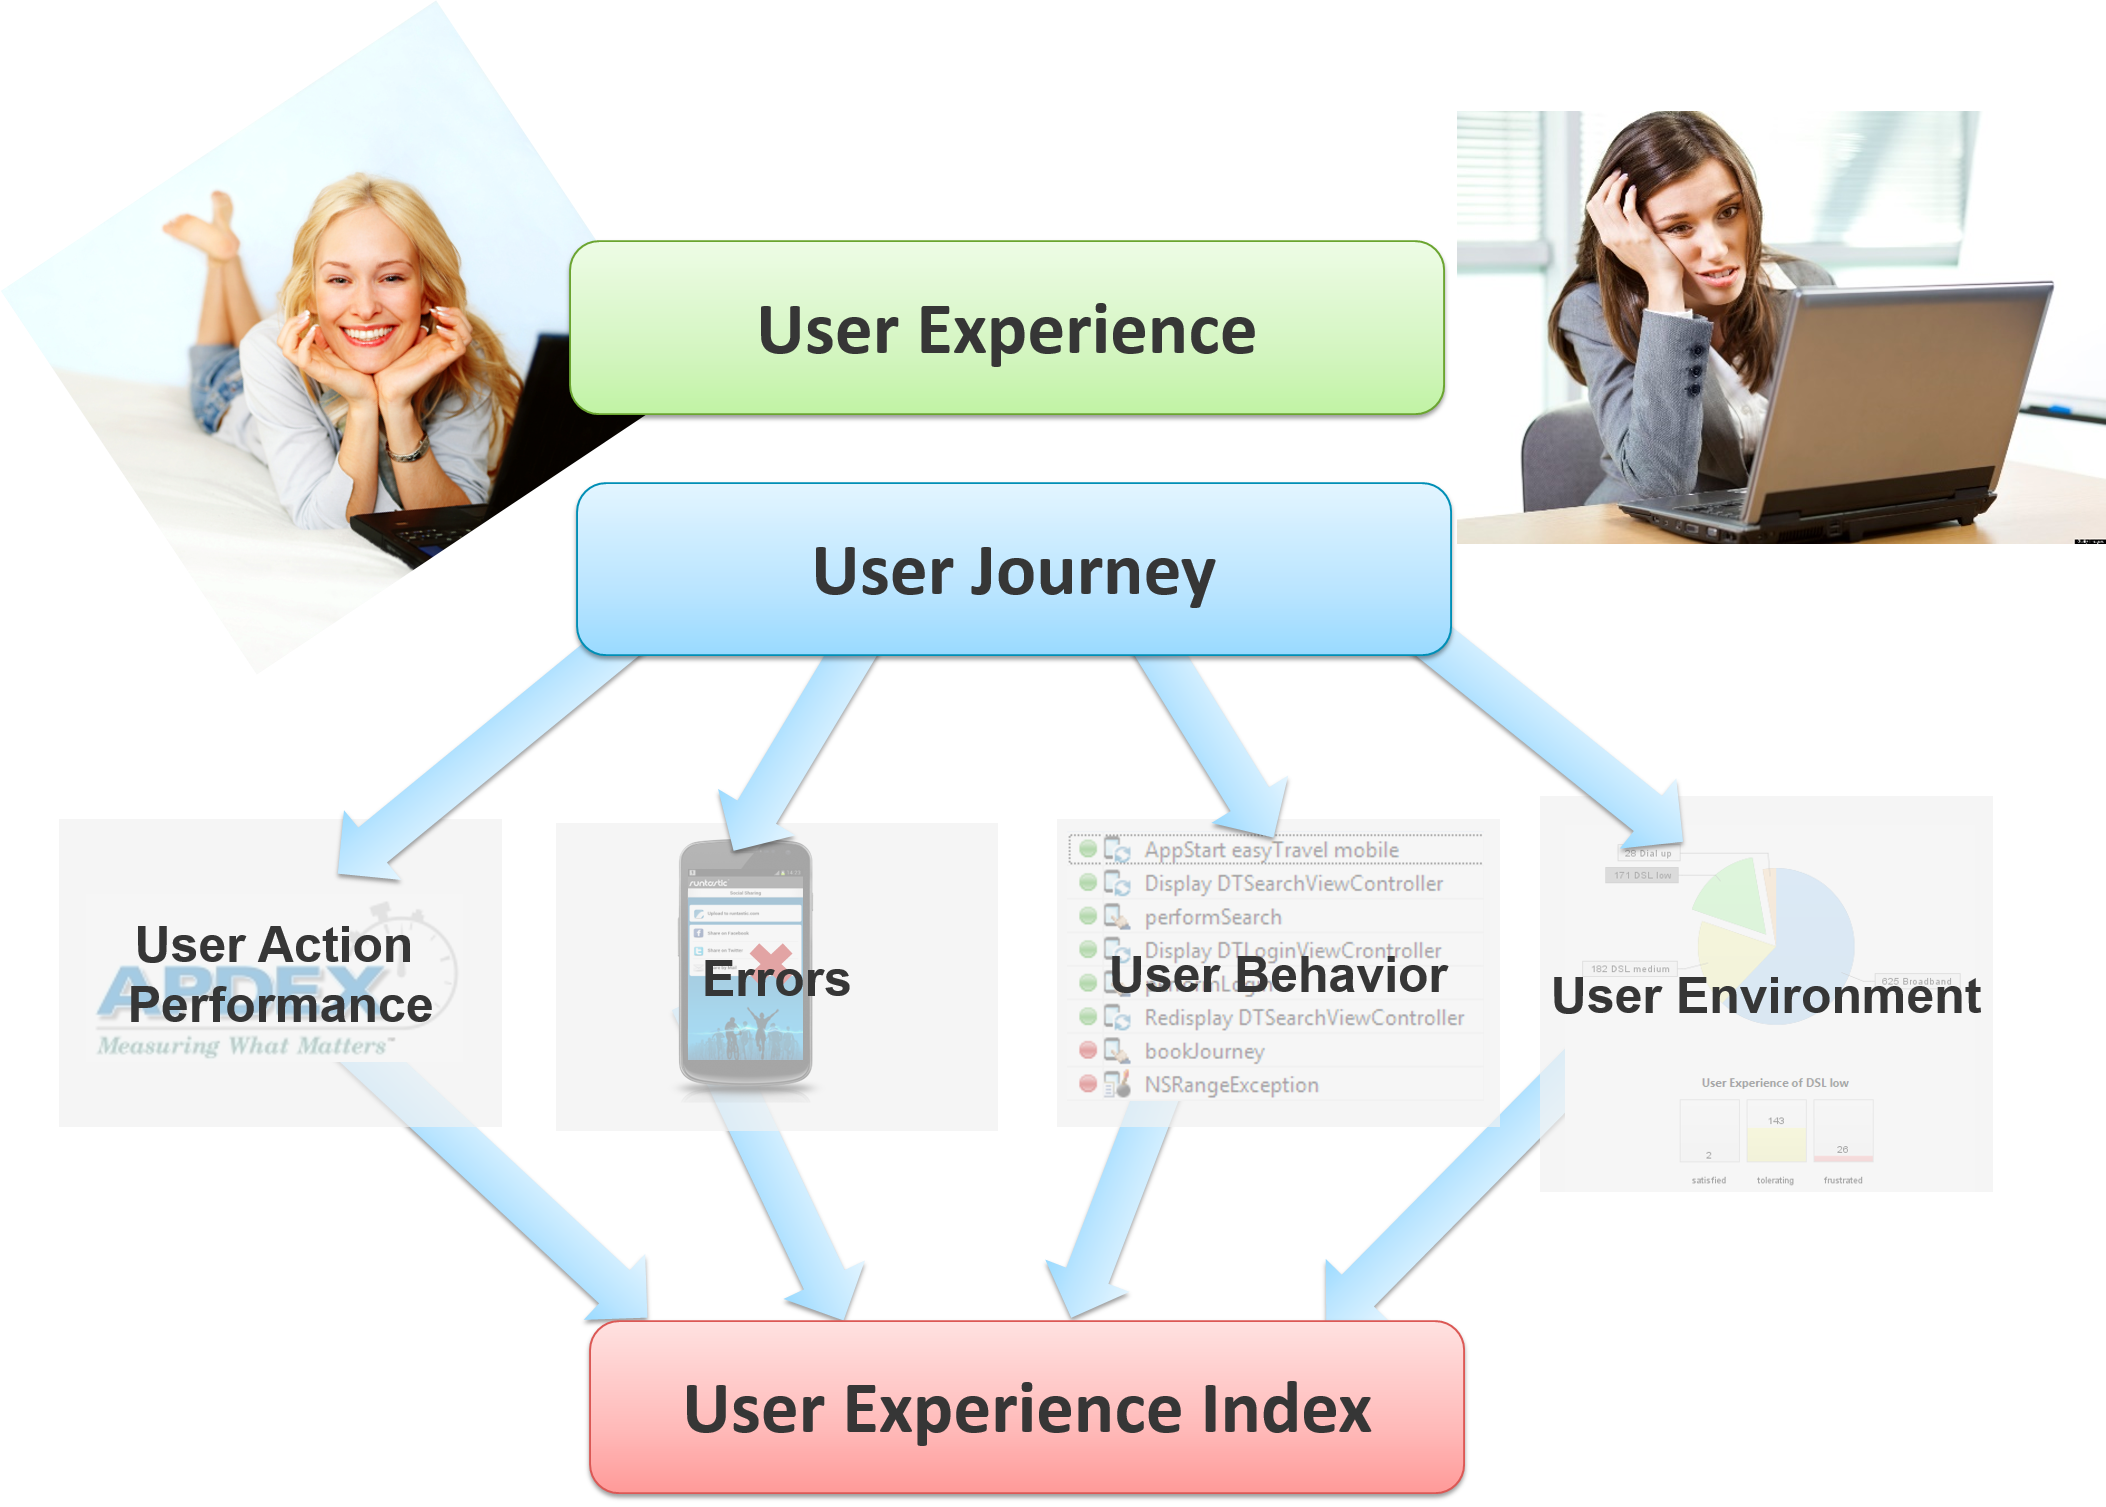
Ingredient 1: User Journey
It was easy to find out how a user’s journey looked like when each click on the website triggered a new page to load. But in today’s omni-channel world with mobile apps and single page load web applications, we can no longer rely on this concept. A simple common denominator to all these channels, besides the user, is the user’s action. User actions represent client side activity like loading a page, clicking on a button or swiping a screen and waiting for the application to react to that input. Therefore, I suggest collecting the user journey based on the user actions. This allows us to figure out what the user did with our application, how long they worked with it, which features they used, etcetera.
Ingredient 2: Performance
Performance is a very important factor when it comes to the frustration of users. People no longer accept long waiting times, especially when they are using modern devices like smartphones. Since we already know that the page load is not a good indicator for today’s applications it should no longer be the metric to measure. Measuring the User action duration would be a much better approach. Let’s specify the user action duration as the time from when the user triggered an action by tapping or clicking till the content appears on their display. Taking this as the new Key Performance Indicator (KPI) and applying the mechanics of the APDEX allows you to get a first important and measurable ingredient for the user experience.
Ingredient 3: Errors
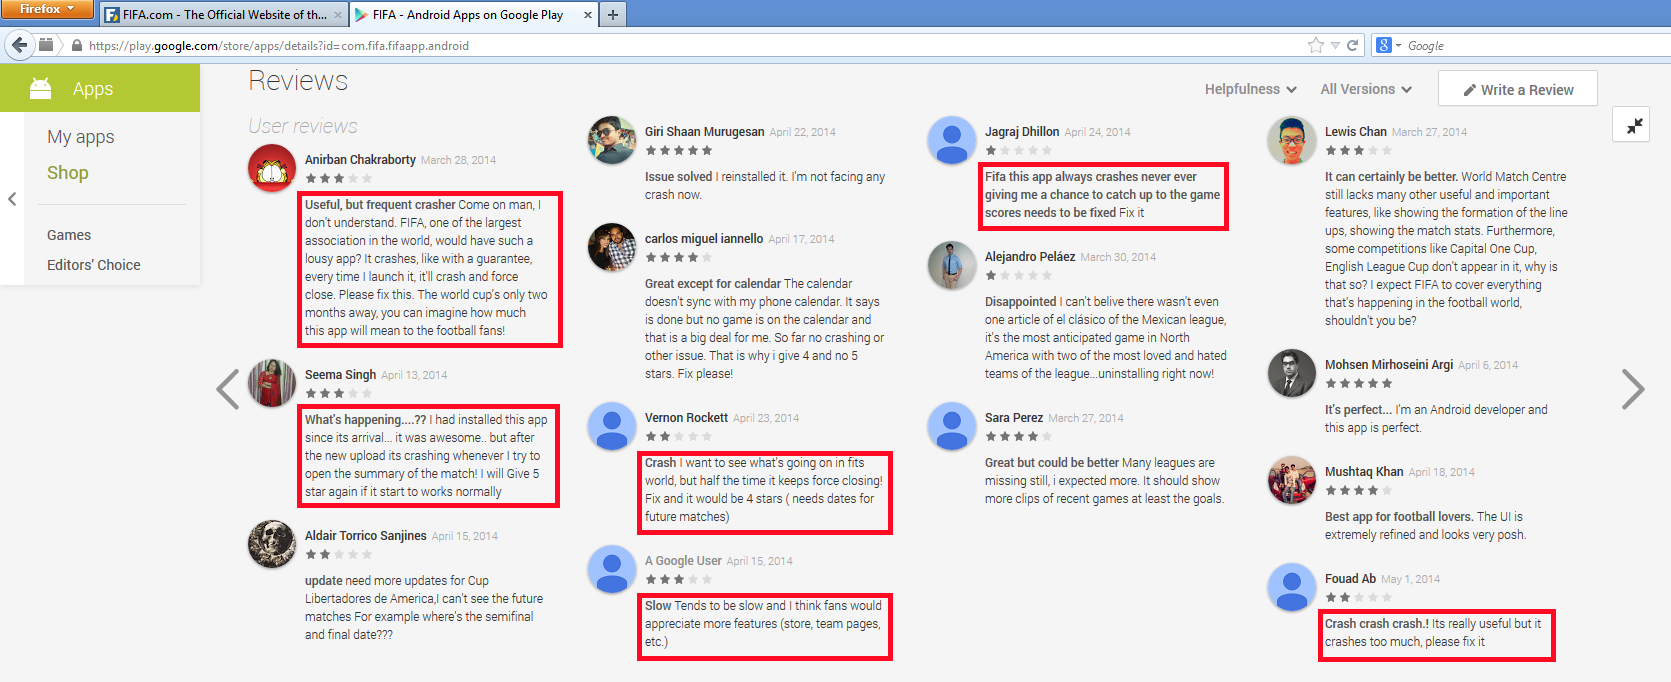
Performance specialists tend to focus on performance as their key indicator and sometimes forget about the fact that there will be errors. Errors are more annoying than anything else: whether the app crashes, communication with the server side fails or a JavaScript error occurs. A good, or should I better say, bad example was last year’s FIFA World Cup App which I analyzed back in May because people where frustrated with it. Everyone could learn this easily by looking at the app reviews in the app store. Capturing and counting the errors during the user journey is, therefore, the next ingredient on the way of measuring the user experience the right way.
Ingredient 4: User Behavior
Sometimes the user’s behavior is already telling us that their experience is frustrating. A very simple and often seen user behavior pattern is people leaving if a single action fails to meet expectations. If we, therefore, look at the last action we can learn a lot about user frustration. There are multiple other patterns that we can consider and apply to the user experience calculation.
Ingredient 5: User Environment
We have learned over the years that depending on the network connection or location of where we are, we can expect different performance. If we are used to a slow network connection we are also used to slow user action times. Knowing the bandwidth that a user has during their interaction allows us to adjust the threshold for the APDEX calculation for this single visit.
The User Experience Index
For each visit we calculate whether it was a satisfied, tolerating or frustrated experience and weight them with 1 = satisfied, tolerating = 0.5 and frustrated = 0. With that we can average over all our users and get the User Experience Index which is a value between 0 and 1. This leaves the question open how to put the 5 ingredients together to get the satisfaction level for a single user.
Frustrated users are defined by:
- Suspicious usage pattern is detected
- More than 50% of all user actions are frustrated according to the APDEX calculation adjusted by the bandwidth factor or due to errors
Satisfied users are defined by:
- No suspicious usage pattern is detected
- No frustrated user action
- There are no more than 50% of all user actions considered as tolerating according to the APDEX calculation adjusted by the bandwidth factor
- No erroneous user action during the user journey
Tolerating user experience is defined by:
- No suspicious usage pattern is detected
- Less than 50% of all user actions are frustrated according to the APDEX calculation adjusted by the bandwidth factor
- More than 50% of all user actions are considered as tolerating according to the APDEX calculation adjusted by the bandwidth factor
Conclusion
To find out whether our users are happy or not we can take technical metrics and look at each user journey and evaluate it. This way we are no longer be blind and are able to increase conversion and user satisfaction by changing the layout, color, images and other things, that matter, but won’t improve the user experience if they are embedded in a slow or erroneous app.


Looking for answers?
Start a new discussion or ask for help in our Q&A forum.
Go to forum