AWS Database Blog
Enabling low code graph data apps with Amazon Neptune and Graphistry
One of the common challenges to unlocking the value of graph databases is building easy-to-use, customer-facing data tools that expose graph-powered insights in impactful and visual ways. Data engineers need to inspect data quality, data scientists need to perform discovery and inspect models, analysts need to investigate connections, and managers need insight into what’s going on. The ability for a project to make data easily accessible is often the difference between reaching many users in your organization vs. having little return on your project. However, all too often, creating these data applications isn’t easy, as trying to combine the required components together quickly turns into a slog. Recently, Graphistry released a new open-source tool, graph-app-kit, which aims to solve this problem by providing a low code way to create powerful data applications for your Amazon Neptune managed graph database.
graph-app-kit pairs the simplicity of a Streamlit data app, with point-and-click visual analytics tools of the GPU-accelerated Graphistry platform, all backed by a robust and scalable graph database in Neptune. The combination enables you to investigate your graph while performing analytical operations, such as viewing key clusters, as shown in the following animation.
The GPU acceleration provided by Graphistry means even large Neptune results can be visually analyzed in a web browser.
In this post, we demonstrate how to use graph-app-kit to generate a full-stack dashboard, complete with GPU-backed graph analytics on top of Neptune. We cover the process of launching Neptune, configuring and launching graph-app-kit, and building your first dashboard, by only modifying a few lines of code. For our data, we build upon the identity graph used in the post Building a customer identity graph with Amazon Neptune to construct an interactive enterprise-ready data dashboard that can be made available to business users like security and fraud, sales and marketing, and supply chain and logistics.
Overview of solution
Before we dive into the details, let’s first take a moment to answer the question: What is graph-app-kit?
graph-app-kit is an open-source software project that integrates best-of-breed tools in the Python data science ecosystem:
- Streamlit dashboarding with Jupyter notebook authoring
- Tabular and graph analytics packages, including the RAPIDS GPU ecosystem with cuDF, cuGraph, and Graphistry for GPU visual graph analytics
- Database adapters, such as for Neptune, for a robust and scalable graph database optimized for storing billions or relationships and querying them with millisecond latency
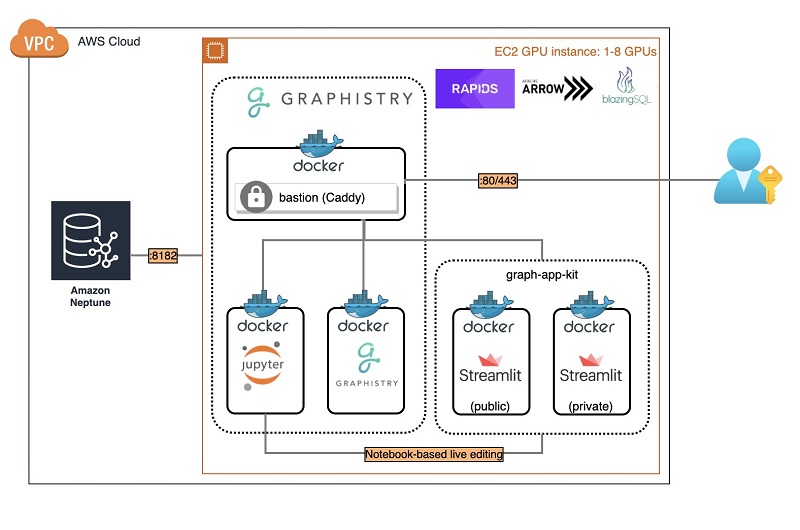
The core of graph-app-kit is a Docker host used to run all these technologies. Docker provides standardized configuration, launching, and operation, resulting in a quick-to-deploy system. The architecture of a deployed graph-app-kit instance consists of five containers:
- The first of these containers is a reverse proxy server, using Caddy, which directs incoming requests to one of four backend containers.
- Two of these containers run Streamlit dashboards, one configured to serve public-facing dashboards and the other configured to serve private password-protected dashboards.
- The remaining two containers are part of the Graphistry platform. One of these containers runs the Graphistry platform, while the other runs a Jupyter server that is used to interact with both Graphistry.
The following diagram shows the architecture of the launched graph-app-kit stack for Neptune.
This post covers the latest version of graph-app-kit, but for any future changes and potential customizations, we suggest you refer to the graph-app-kit tutorials in the GitHub repo.
To get started deploying this stack, we have provided AWS CloudFormation templates for both Neptune and graph-app-kit, which make it easy to launch and manage your stacks. When you create this stack, you will be responsible for AWS charges incurred.
Launching Neptune (optional if using an existing cluster)
The first step in our deployment is to create our Neptune cluster and load the identity dataset. This data, such as the device identifiers, browsers, cookies, and history of sites visited or mobile apps used, represents a unique identity for a collection of users. This data also contains known demographics about the user based on information provided through various account profiles. This data is highly connected and is similar to what you might find via web server logs or clickstream data, as shown below.

To use a GPU, you must selection an AWS region with a GPU quota. If you already have a Neptune instance with identity data, you can skip ahead to the next step.
- Launch Neptune with the preloaded identity data from the identity graph tutorial. Choose the stack for your preferred Region:
Region View Launch US East (Ohio) View 
US East (N. Virginia) View US West (Oregon) View EU (Ireland) View
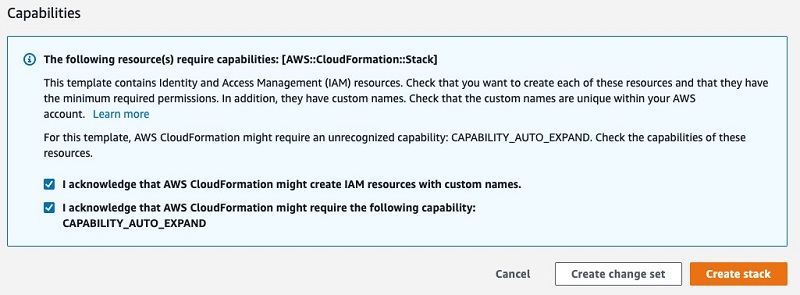
- In the Capabilities section, select the two check-boxes that grant the stack permissions to create the AWS Identity and Access Management (IAM) roles.
- Choose Create stack.
The process of creating your stack may take up to 20 minutes to complete.
- When the process is complete, open the generated
Identity-Graph-Samplestack’s Outputs It displays the values you need to configure graph-app-kit:- VPC – ID
vpc-abc - PublicSubnet1 – ID
subnet-abc - DBClusterReadEndpoint – URL
abc.cluster-ro-xyz.zzz.neptune.amazonaws.com
- VPC – ID
To facilitate a fast bulk load of the sizable identity dataset, this CloudFormation script uses a Neptune cluster with an r5.12xlarge instance. After you complete this step, we recommend resizing the Neptune instance size to an r5.2xlarge to reduce the overall cost. You can view the Amazon Neptune costs on the pricing page.
Launching graph-app-kit
The CloudFormation template uses the Graphistry Core offering in the AWS Marketplace, which requires you accept its terms and conditions.
After we launch Neptune, we’re ready to configure and launch graph-app-kit.
- Launch graph-app-kit for the Region where your Neptune cluster resides and you have GPU EC2 instances enabled:
Region View Launch US East (Ohio) View US East (N. Virginia) View US West (Oregon) View EU (Ireland) View
- Fill in the launch settings using the output values you recorded earlier and select the instance size.
Make sure that the VPC and subnet chosen are capable of connecting to the VPC of your Neptune cluster and that the subnet is the public subnet, so that you are able to access graph-app-kit from the internet.
The least expensive self-managed GPU and Graphistry configuration for graph-app-kit is g4dn.xlarge (EC2 pricing information). To further lower costs by going CPU-only and with a free Graphistry Hub account, see Configuration 2: Minimal.
- Choose Create Stack to begin the stack creation.

If your account isn’t configured for GPU capacity, you can launch a minimal CPU-only version of graph-app-kit with a subset of the components.
Launching graph-app-kit may take up to 10 minutes to complete. To monitor the progress of the installation, SSH into the instance (user ubuntu) and run the following code:
When the stack creation is complete, the public IP address is available on the stack’s Outputs tab on the AWS CloudFormation console.

With graph-app-kit deployed, the following features are now available:
- All public dashboards can be viewed at
http://[the.public.ip.address]/public/dash - Private dashboards are available after logging in at
http://[the.public.ip.address]/private/dash - You can access notebooks to live-edit dashboards at
http://[the.public.ip.address]/notebook - Administrator functions are located at
http://[the.public.ip.address]/admin
The default login credentials for protected pages are admin / i-theInstanceID and should be changed upon first login.
Sample Gremlin dashboard
graph-app-kit runs Python-based dashboards using Streamlit. Let’s take a look at one of the dashboards that comes out of the box with graph-app-kit.
From the drop-down menu, choose Gremlin: Simple Sample. A view is shown with a layout consisting controls on the left that filter the data, in this case a slider for the number of edges to show, and a main content area that shows filtered data, in this case the Graphistry browser.
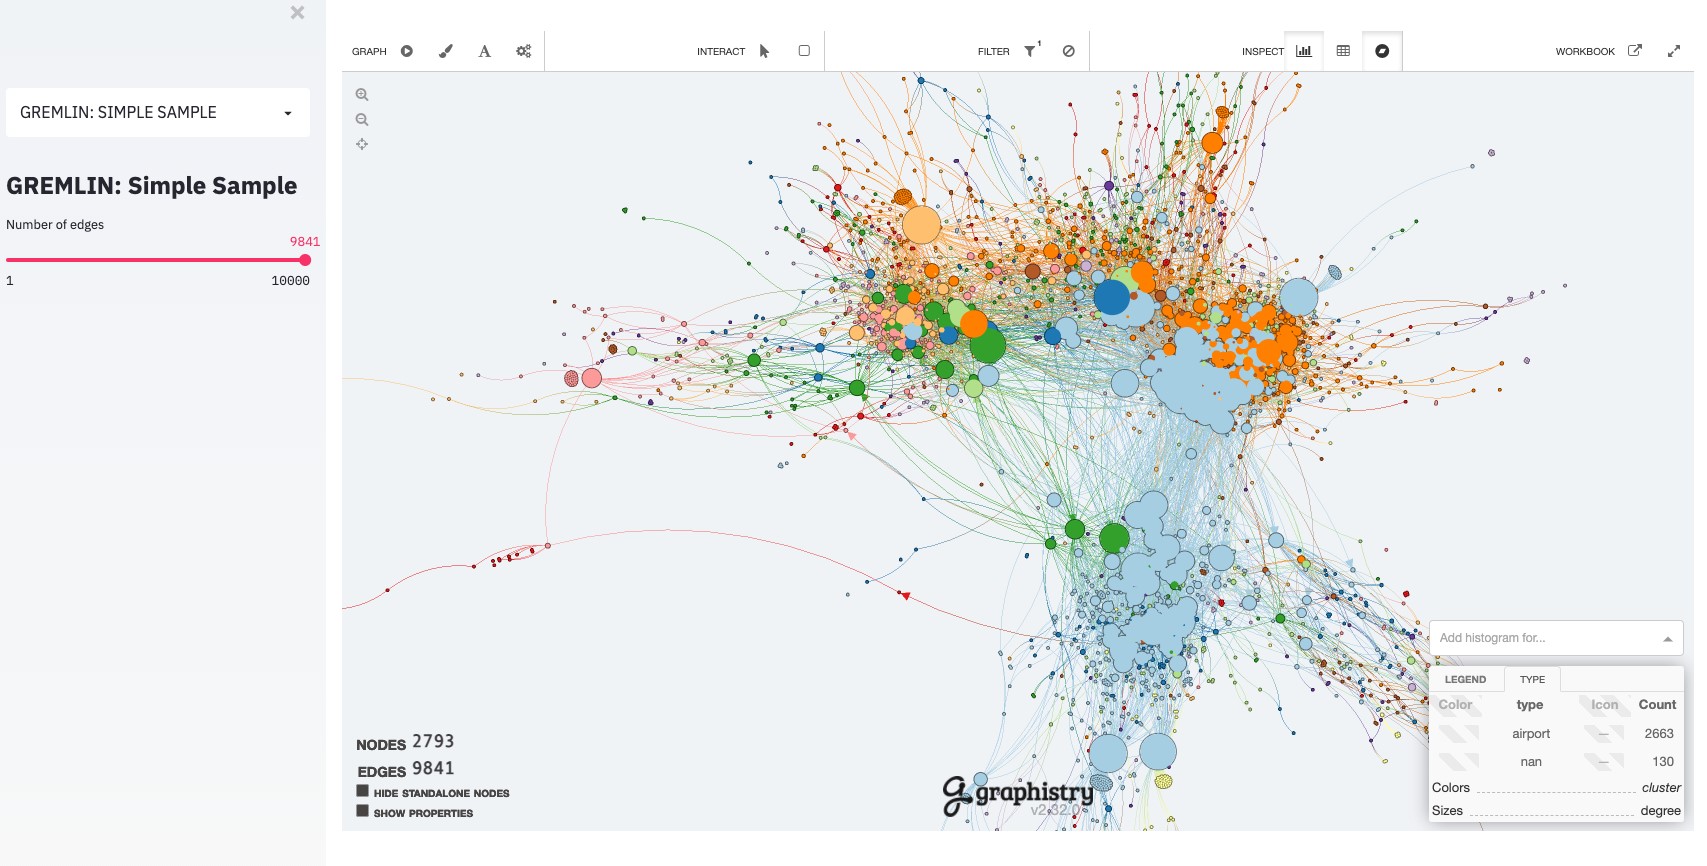
Changing the filtering controls causes the dashboard to populate the Graphistry browser with data from the Neptune database.
Creating a new dashboard
One of the top use cases for a graph data app is enabling users to filter data by predefined attributes and visually explore the resulting graph. We’ve looked at a very simple dashboard with a single filter, but in many cases, you want to have multiple different criteria to refine your filter. Let’s see how we can extend that view to add additional filters to our dashboard.
For this post, we copy and modify the existing view of our sample Gremlin database to add the ability to filter our results by state. The process of creating most new dashboards is easy to accomplish and involves the following steps:
- Clone the existing view, in this case the Gremlin sample.
- Register the new view in Streamlit.
- Add or modify any filtering UI controls. For this post, we add a drop-down menu to filter by state.
- Update the view’s query to incorporate the filter control values.
Cloning the Gremlin sample view using Jupyter’s file browser
To create our new view, named Blog Search Demo, we copy an existing Gremlin sample view. You can accomplish this by a variety of methods, but for this post, we use Jupyter, which is included as part of graph-app-kit.
- Go to
http://[the.public.ip.address]/notebook/tree/notebooks/graph-app-kit/public/views/, and log in. - From the New drop-down folder, choose Folder.
- Choose the generated folder Untitled.
- Choose Rename.
- Enter
blog_search_demo. - Navigate to
http://[the.public.ip.address]/notebook/tree/notebooks/graph-app-kit/public/views/demo_neptune_01_minimal_gremlin. - Choose Duplicate and Duplicate selected.
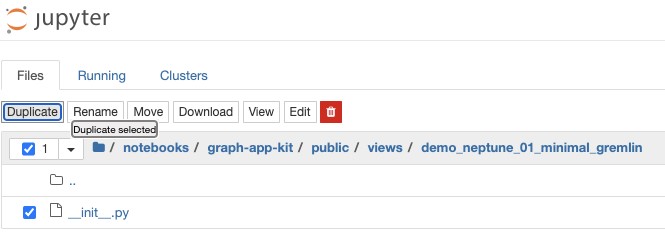
- Select our newly duplicated file and choose Move.
- Move it to
/notebooks/graph-app-kit/public/views/blog_search_demo. - Go to your new folder
blog_search_demoand select the copied file. - Rename it to
_init_py.
Registering the new view in Streamlit
Now that we have created a copy of this view, we need to register this view with Streamlit by giving it a name and unique application ID. The name property is the name of the dashboard in the UI, and app_id is used for the lexicographic sort order of dashboards on the dashboard drop-down menu. To change these properties for our new view, complete the following steps:
- Using Jupyter’s file browser, choose the file
_init_.pyto open it for editing. - At the top of the file, make the following changes:
- For
app_id, changeapp_neptune_01 to blog_search. - For name, change
GREMLIN: Simple Sample to Blog - Faceted search.
- For
- Save the file.
- Go to
http://[[the.public.ip.address]]/public/dash. - From the drop-down menu, choose Blog – Faceted Search to refresh your browser to the new view.

Adding the filter control
Most graph-app-kit views are variants of the same flow: show filters, pass their settings to a query runner, then pass the query results to a main area results renderer. In our example, we need to add a new filter control to the sidebar_area() method and incorporate the new filter into our query, which we complete in the following sections.
Our first step is to add a new filtering control to the sidebar by editing the sidebar_area() method. Out of the box, Streamlit comes with a variety of different filter controls such as sliders, drop-downs, and text boxes, which we can use to add additional filtering criteria to our application. For this post, we add a new drop-down menu containing the states to the UI by adding the st.sidebar.selectbox() call to our method.
If we want the filter value to be part of the URL, such as for when sharing links, we can also copy the URL init and set pattern used in the next lines for the num_edges UI control. Finally, we expose the filter controls’ value by returning from sidebar_area() method. See the following code:
Updating the Gremlin query to incorporate the filter
With our new filter UI control in place, we update the query to utilize this new filter. First, we add the new filter setting state into the method signature for run_filters(). Next, we add an additional step to our Gremlin traversal to include the filtering criteria when it is set. The following code shows our updated method:
When we save the file and reload the browser, our users can now filter data by state and see the results. The following screenshot shows the interactive dashboard with custom state filter.

Examining this visualization quickly reveals the top clusters in the filtered identity graph.
Although not covered in this post, graph-app-kit also includes examples of how to integrate additional GPU-accelerated analytics projects common in the RAPIDS ecosystem, such as cuGraph and BlazingSQL. The dashboard examples show using GPU acceleration to make analytical and machine learning UIs interactive on larger data.
Conclusion
When you add up the blue lines of code, this was surprisingly little work. graph-app-kit took care of the plumbing, all the way through deployment, data pipeline, and the UI. Your team can focus on just repeating the short graph-app-kit process for your custom view. Being able to quickly share purpose-built tools means more of your users can finally leverage the power of graph analysis and drive insights from their business data.
In this post, we showed you how to do the following:
- Launch a full graph dashboarding stack in your private cloud
- Create a new Streamlit view straight from Jupyter
- Add a new UI filter control
- Run a custom Gremlin graph query over your Neptune graph database
- Show the results with GPU-accelerated interactive graph visualization using Graphistry’s Python client
As you bring graph data to more of your organization, join us in the Graphistry community chat and feel free to contribute your extensions! If you have any questions, comments, or other feedback, we’re always available through your Amazon account manager or via the Neptune Discussion Forums.
About the Authors
 Leo Meyerovich is the founder and CEO of Graphistry Inc for 100X’ing investigations with GPU-accelerated visual graph analytics and workflow automation. His previous research in high-performance computing, security verification, and programming language design received awards including SIGPLAN 10 Year Test of Time and multiple best-paper awards.
 Dave Bechberger is a Sr. Graph Architect with the Amazon Neptune team. He used his years of experience working with customers to build graph database-backed applications as inspiration to co-author “Graph Databases in Action” by Manning.

Taylor Riggan is a Sr. Specialist Solutions Architect focusing on graph databases at AWS. He works with customers of all sizes to help them learn and use purpose-built NoSQL databases via the creation of reference architectures, sample solutions, and delivering hands-on workshops.